Measure and Analyze
The following measurement tools are available:
§ Distance
§ Area
§ Volume
§ Viewshed
§ Inspector (only in TerraExplorer Fusion Plus)
§ Clear Path (only in TerraExplorer Fusion Plus)
§ High and Low (only in TerraExplorer Fusion Plus)
§ Cross Section (only in TerraExplorer Fusion Plus)
§ Visibility Dome (only in TerraExplorer Fusion Plus)
§ Save and Display Measurement and Analysis Objects
The Clear Path, High and Low, and Visibility Dome analysis tools are hidden by default.
To enable them:
1. Navigate to the the custom.css file that is under the application files' "./custom folder".
2. Locate the following lines (usually near the end) and comment out the ones for the tools you want to enable:
§ #clearPathBtnDiv { display: none }
§ #HighLowBtnDiv { display: none }
§ #visibilityDomeBtnDiv { display: none }
This will unhide the tools that you have commented out.
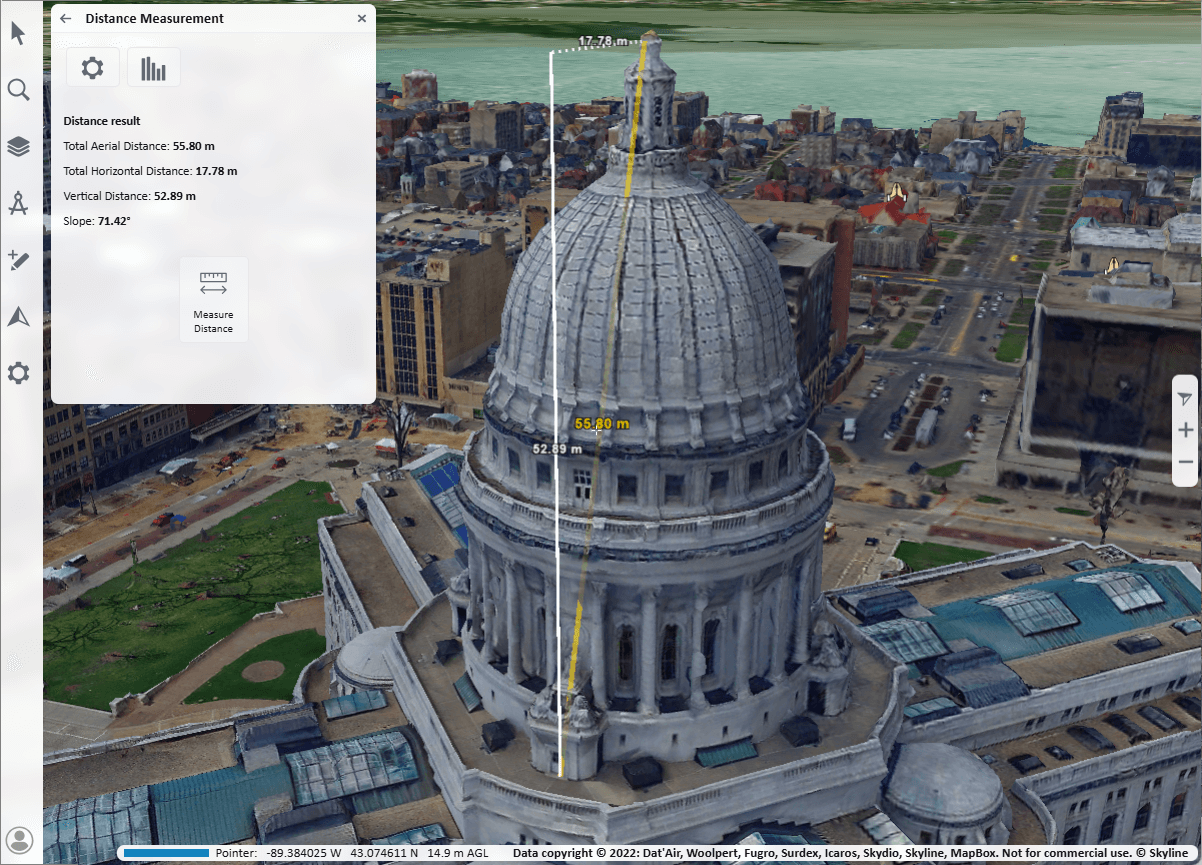
Measure Distance
To measure distance:
1. On the side toolbar > ![]() > Tools tab > Distance.
> Tools tab > Distance.
2. Click any point on the terrain or on an object to define the start point of the measurement, and then click to set the second point. If Multiline is switched off in Settings, the measurement will automatically complete after two points. If Multiline is switched on, you can click to add additional segments, and then right-click to finish. If you want to delete the last point drawn, click Undo ![]() . By default, the aerial distance is displayed in the distance measurement panel as well as in the 3D Window. Use the switches in the Distance Settings
. By default, the aerial distance is displayed in the distance measurement panel as well as in the 3D Window. Use the switches in the Distance Settings ![]() panel to turn on/off the display of aerial, horizontal, and vertical distance measurements in the 3D Window. Aerial distances are marked as solid yellow lines, while horizontal and vertical distances are displayed as dashed white lines.
panel to turn on/off the display of aerial, horizontal, and vertical distance measurements in the 3D Window. Aerial distances are marked as solid yellow lines, while horizontal and vertical distances are displayed as dashed white lines.
Note: While a measurement is in progress, you can stop it and start a new one by clicking Cancel.
3. If you want to calculate a terrain profile for the path defined by the line you drew, in the Distance Measurement panel, click Terrain Profile ![]() . When calculation is complete, a terrain profile graph is displayed, showing the terrain elevation profile. Turn on the information you want indicated on the graph: polyline waypoints, min/max altitude and max slope.
. When calculation is complete, a terrain profile graph is displayed, showing the terrain elevation profile. Turn on the information you want indicated on the graph: polyline waypoints, min/max altitude and max slope.
Distance measurement settings are set in the Distance Settings ![]() panel. These settings are saved on the machine the project is running on.
panel. These settings are saved on the machine the project is running on.
To set distance measurement settings:
§ On the side toolbar > ![]() > Tools tab > Distance >
> Tools tab > Distance > ![]() .
.
|
Units |
Select either Kilometers/Meters or Miles/Feet. The units will automatically switch to kilometers if the number of meters exceeds 2,000, or to miles if the number of feet exceeds 10,000. |
|
Save Measurement |
Select one of the following: § Delete when Exit – Delete the measurement after the Distance tool is closed. § Save in Project – Save the measurement results in the project. |
|
Switch Multiline on to allow measurements of more than two points. When Multiline is switched off, distance measurements automatically complete after the second point is added, eliminating the need to right-click to finish the measurement. |
|
|
Snap Waypoints |
Switch on to enable snapping to object edges or vertices. TerraExplorer Fusion automatically detects all edges, i.e., intersections of two plane faces, and vertices, i.e., intersections of two polylines. |
|
Show… |
Use the switches to turn on/off the display of aerial, horizontal, and vertical distance measurements in the 3D Window. |
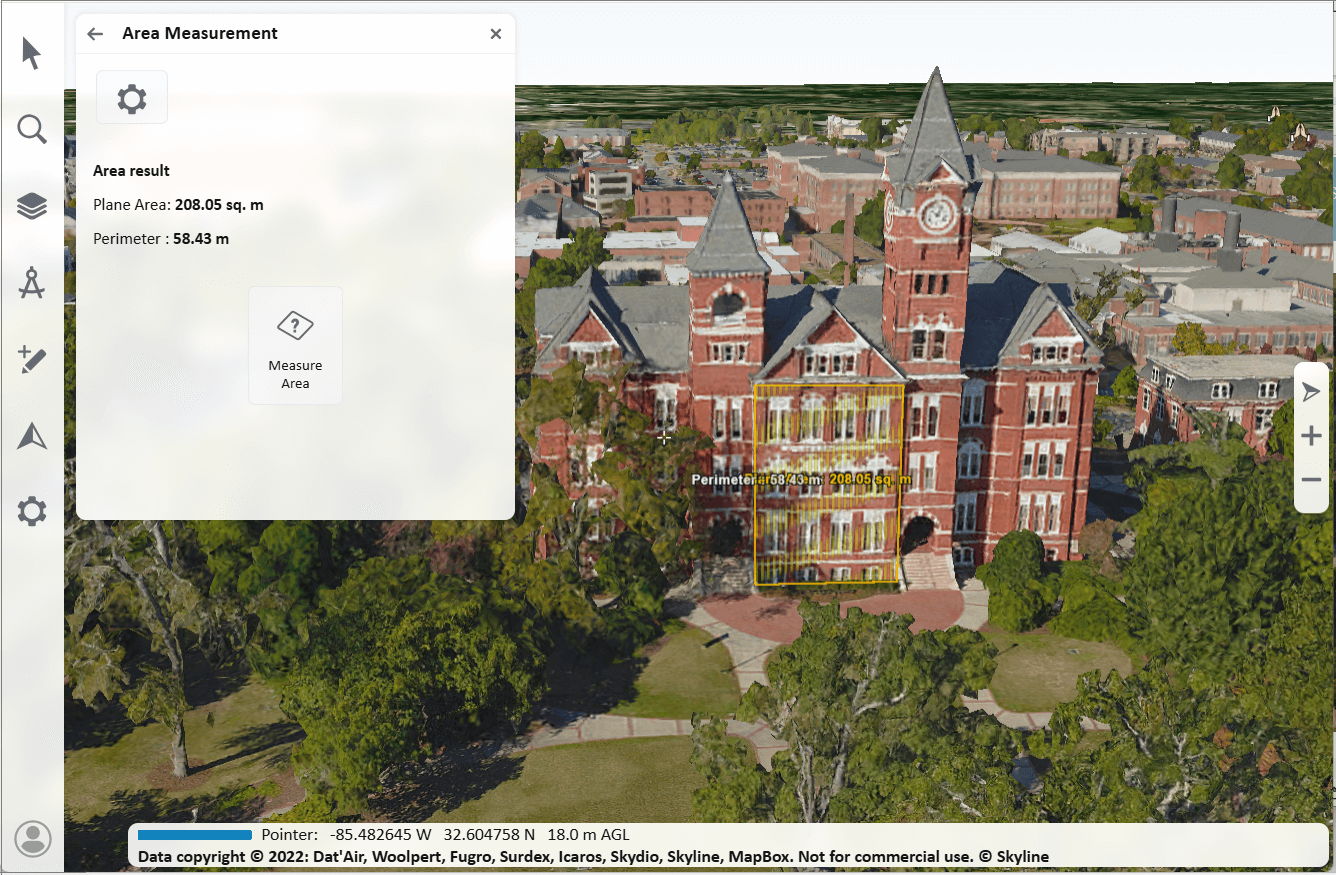
Measure Area
To measure area on an arbitrary plane or the terrain:
1. On the side toolbar > ![]() > Tools tab > Area.
> Tools tab > Area.
2. Click any point on the terrain/plane to define the start point of the measurement, and then click to set the second point and again for each additional point. Right-click to finish. If you want to delete the last point drawn, click Undo ![]() . The calculated area and perimeter area are displayed in the area measurement panel and in the 3D Window.
. The calculated area and perimeter area are displayed in the area measurement panel and in the 3D Window.
Note: While an area measurement is in progress, you can stop it and start a new one by clicking Cancel.
Area measurement settings are set in the Area Settings panel. These settings are saved on the machine the project is running on.
To set area measurement settings:
§ On the side toolbar > ![]() > Tools tab > Area >
> Tools tab > Area > ![]() .
.
|
Measurement Type
|
Select one of the following: § Automatic – Automatically determines the projection type based on the normal of the plane formed by the first three points drawn. If the normal's angle is less than 25 degrees (where 0 degrees represents a horizontal surface with a vertically aligned normal), the projection will be horizontal. Otherwise, the tool will create a 3D plane projection based on these three points. § Horizontal Projection – Always calculate area on terrain. The area measured is the horizontal projection of the area you have outlined, even if some or all your selected area encompasses mountainous terrain. § 3D Plane – Always calculate area on an arbitrary plane. The polygon’s orientation is determined by the first three points drawn. |
|
|
Units |
Select either Kilometers/Meters or Miles/Feet. The units will automatically switch to kilometers if the number of meters exceeds 2,000, or to miles if the number of feet exceeds 10,000. |
|
|
Save Measurement |
Select one of the following: § Delete when Exit – Delete the measurement after the Distance tool is closed. § Save in Project – Save the measurement in the project. |
|
|
Snap waypoints |
Switch on to enable snapping to object edges or vertices. TerraExplorer automatically detects all edges, i.e., intersections of two plane faces, and vertices, i.e., intersections of two polylines. |
|
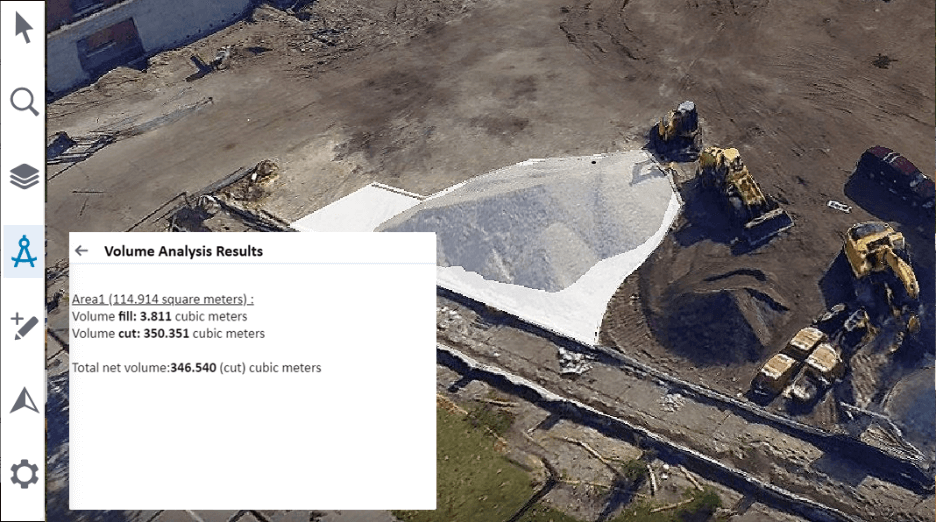
Measure Volume Added or Removed
Analyze the volume of the terrain or model removed or added by drawn horizontal planes. This tool is only available in Chrome and Edge browsers.
To measure volume:
1. On the side toolbar > ![]() > Tools tab > Volume.
> Tools tab > Volume.
2. Click Draw Area, and then in the 3D Window, draw a polygon on the terrain or model, defining a horizontal plane. Click to add the first point of the horizontal plane polygon. The first point placed defines the altitude of the polygon. Click again to add additional points of the polygon until you have marked the entire shape. Then click Calculate. The analysis results are displayed.
Query Any Point or Object in the 3D World
Query any point or object in the 3D World: This tool is only available in Chrome/Edge browsers.
To perform a query:
1. On the side toolbar > ![]() > Query.
> Query.
2. Click on the point or object for which you require information. The longitude, latitude, and elevation are displayed. When an object or layer is selected, general information about the object and attribute information, if available, is displayed. If the object is a feature layer, you can click the Features button to open the layer’s Attribute Table.

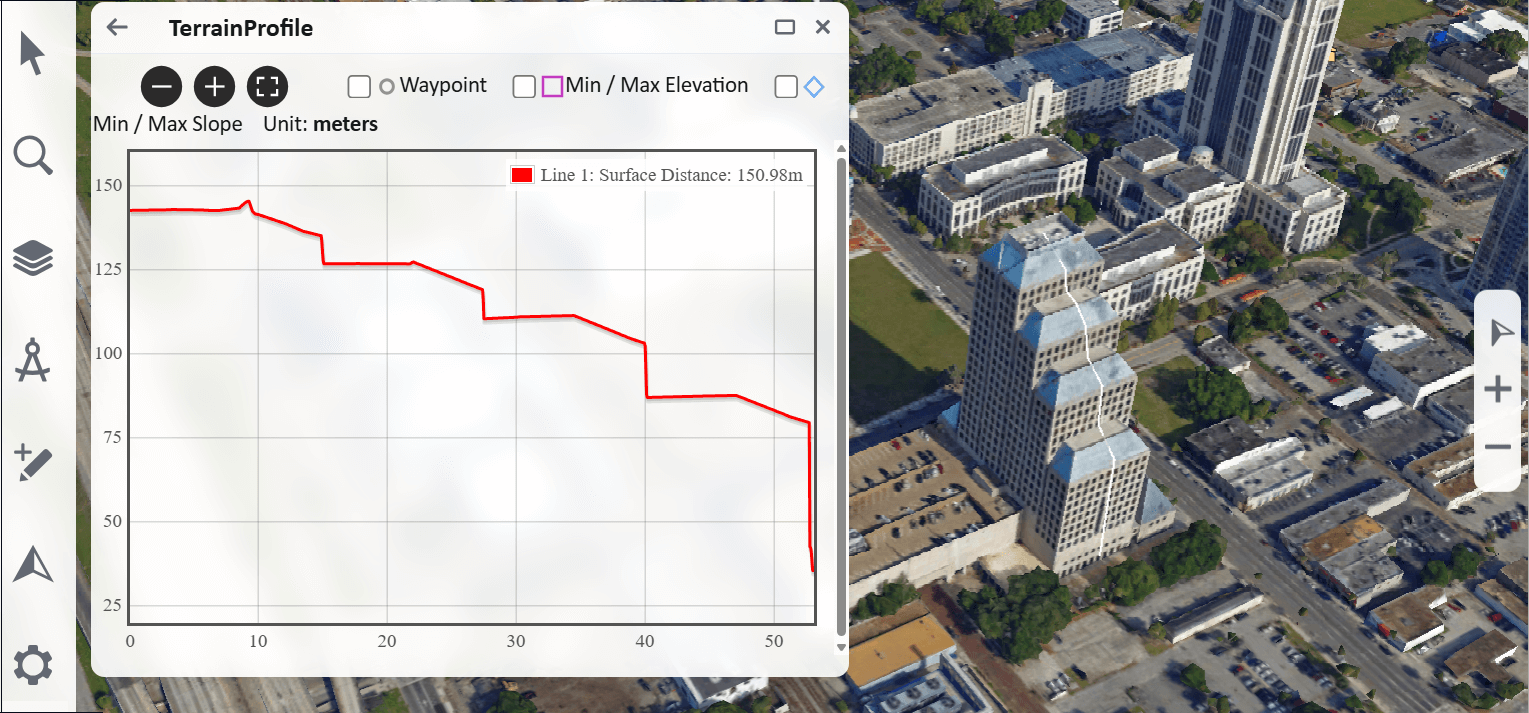
Calculate Elevation Profile
Display the terrain/model elevation profile along a defined path:
1. On the side toolbar > ![]() > Tools tab > Elevation Profile.
> Tools tab > Elevation Profile.
2. Click Draw Line and then click any point on the terrain or model to define the start point of the measurement. Click to set the second point and then again for each additional segment. Then click Calculate. When the calculation is complete, an elevation profile graph is displayed, showing the elevation profile.
3. Select the checkboxes of the information you want indicated on the graph: polyline waypoints, min/max elevation and min/max slope.
Overlay Terrain with Contour and Slope Maps
Display a contour map on the entire terrain :
§ On the side toolbar > ![]() > Maps tab > Contour Map. A contour map overlays the entire 3D Window.
> Maps tab > Contour Map. A contour map overlays the entire 3D Window.
Display a slope map
§ On the side toolbar > ![]() > Maps tab > Slope Map. A slope map overlays the entire 3D Window. Slope map colors are rendered on terrain textures as well as on 3D models.
> Maps tab > Slope Map. A slope map overlays the entire 3D Window. Slope map colors are rendered on terrain textures as well as on 3D models.

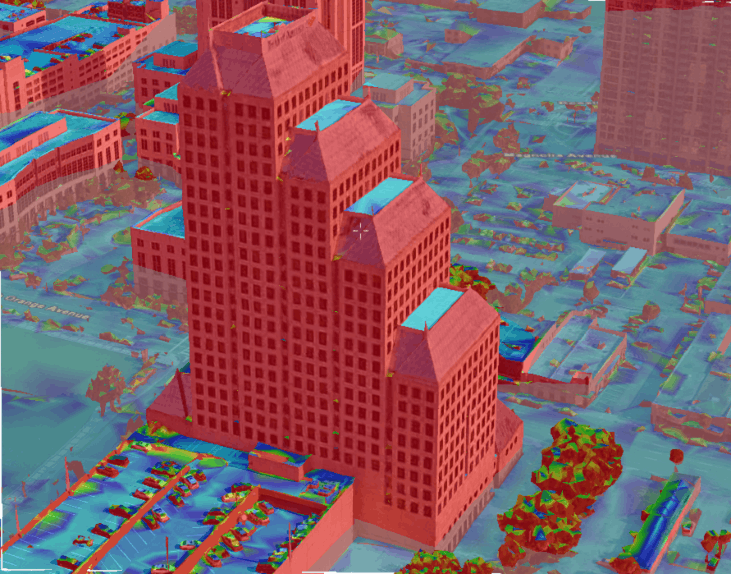
Calculate Viewshed
The 3D viewshed calculates and marks all areas on the terrain and on 3D models and objects that are visible from a selected point on the terrain.
To create a viewshed:
1. On the side toolbar > ![]() > Tools tab > Viewshed.
> Tools tab > Viewshed.
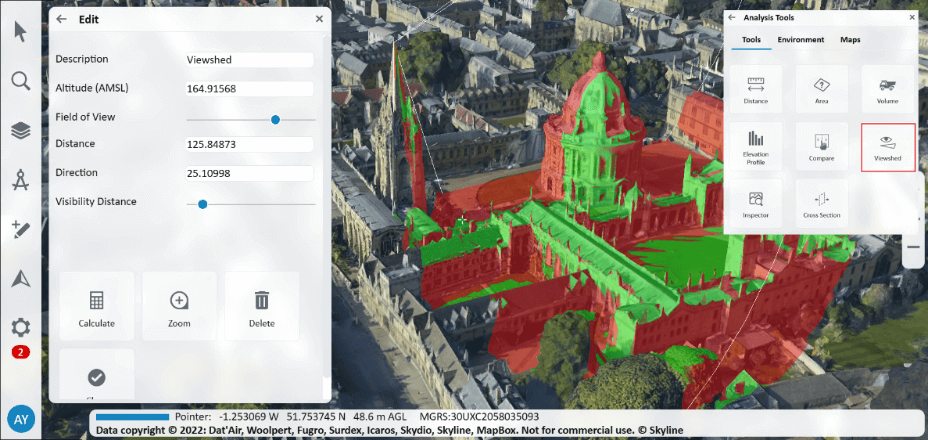
2. In the 3D Window, click to define your viewpoint for the 3D viewshed, and then click again to define your desired endpoint (defining the distance of sight). The viewshed appears on the terrain as a sector of a circle, where the center point is the viewpoint and the arc is the endpoint (marking the end of the distance of sight analysis). Within the sector, areas that are visible from the viewpoint are colored green, whereas areas that are not visible from the viewpoint are colored red.
3. In the viewshed property sheet that is displayed, set its properties:
|
Property |
Description |
|
Description |
The description or name of the 3D viewshed (read-only). This text appears in the sidebar’s Analysis tab as the name of the object. |
|
Altitude |
The altitude above the ground for the viewer location. |
|
Field of View |
Drag the slider to set the angle limits, in degrees, of the viewshed. |
|
Distance |
The length of the viewshed analysis from the viewer in meters. |
|
Direction |
The horizontal angle of the camera when viewing the viewer location. |
|
Visibility Distance |
The distance from the camera at which the viewshed disappears. |
4. The initial viewshed is for preview only. Once you have adjusted the properties as required, if you want to generate a precise viewshed, click Calculate.
5. Set some additional properties:
|
Property |
Description |
|
Spacing |
Distance between each of the rays that is sampled. The lower the value, the more accurate the viewshed but the longer it takes to calculate. |
|
Set Viewer Altitude |
To set an altitude above the ground for the viewer location, enable this option, and then set the Viewer Altitude. |
|
Target Altitude |
Sets the required altitude for the target. |
6. Click Calculate. The 3D viewshed is saved and is available in the My Data section of the Layers panel.
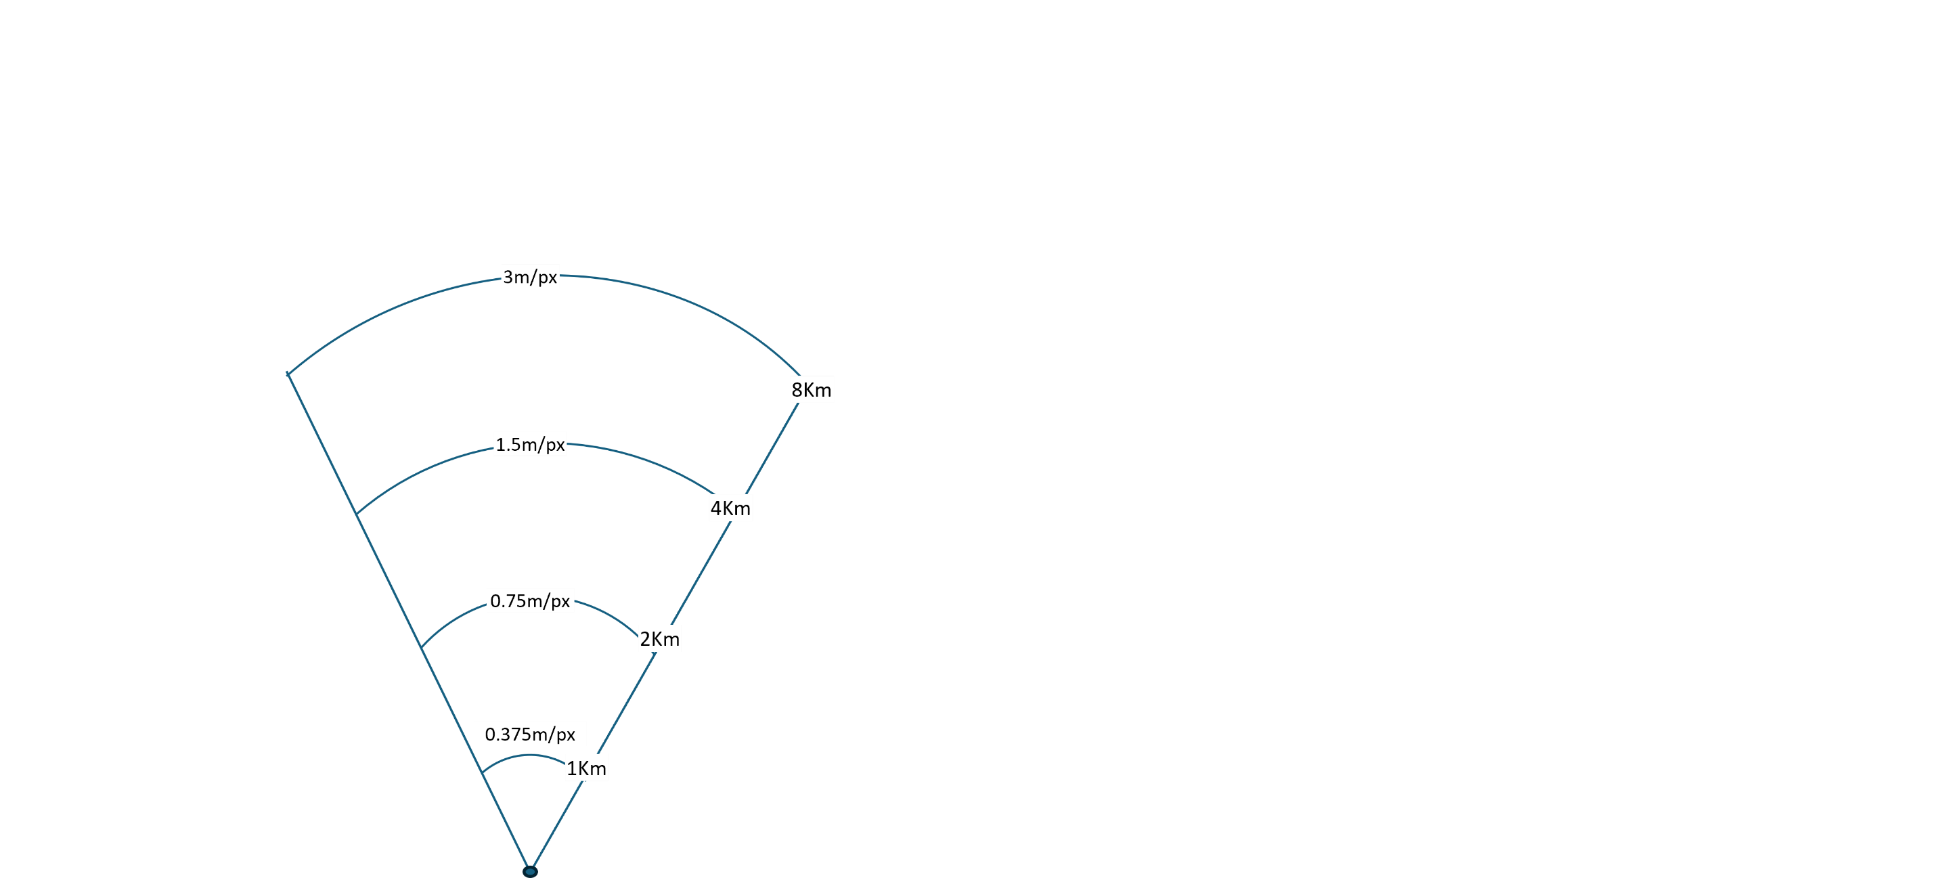
Viewshed Calculation - Resolution Variation with Distance and Field of View:
The resolution of the calculated viewshed is directly affected by both the distance from the selected observed viewpoint and field of view.
Resolution Variation with Distance:
Resolution is highest near the viewpoint and gradually decreases with increasing distance, as follows:
§ 1 km: 0.375 m/px
§ 2 km: 0.75 m/px
§ 4 km: 1.5 m/px
§ 8 km: 3 m/px
Resolution Variation with Field of View Within 1 km of the Viewpoint:
Within 1 km of the viewpoint, resolution is also influenced by field of view. As the field of view increases, encompassing a wider viewshed area, resolution decreases as follows:
§ 30° arc: 0.5 m/px
§ 60° arc: 1 m/px
§ 120° arc: 2 m/px
Additionally, within 1 km, query points will also be displayed on the walls of the model.
Viewshed Display – Distribution of Query Points:
For distances of sight up to 1 km, query points are evenly distributed every 2 meters. Beyond 1 km distance, a grid-based approach is used due to resource considerations and the complexity of long-range visibility assessments. This approach optimizes resource usage while providing meaningful visibility information. The area is divided into grid cells, and within each cell, query points are evaluated for visibility (green for visible, red for hidden):
If all points in a cell are green (visible) or all are red (hidden), the system selects the center point of the cell for display.
§ If a cell contains both green and red points, the system selects the topmost green point (most visible) and the bottommost red point (least visible) for display.

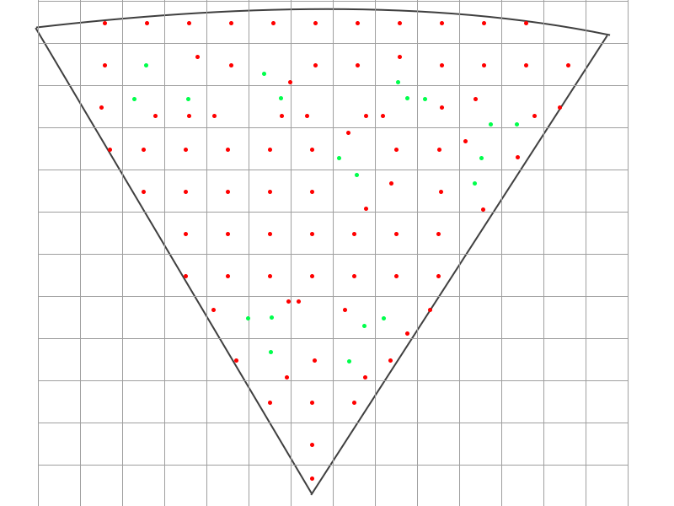
Query Grid Display Grid
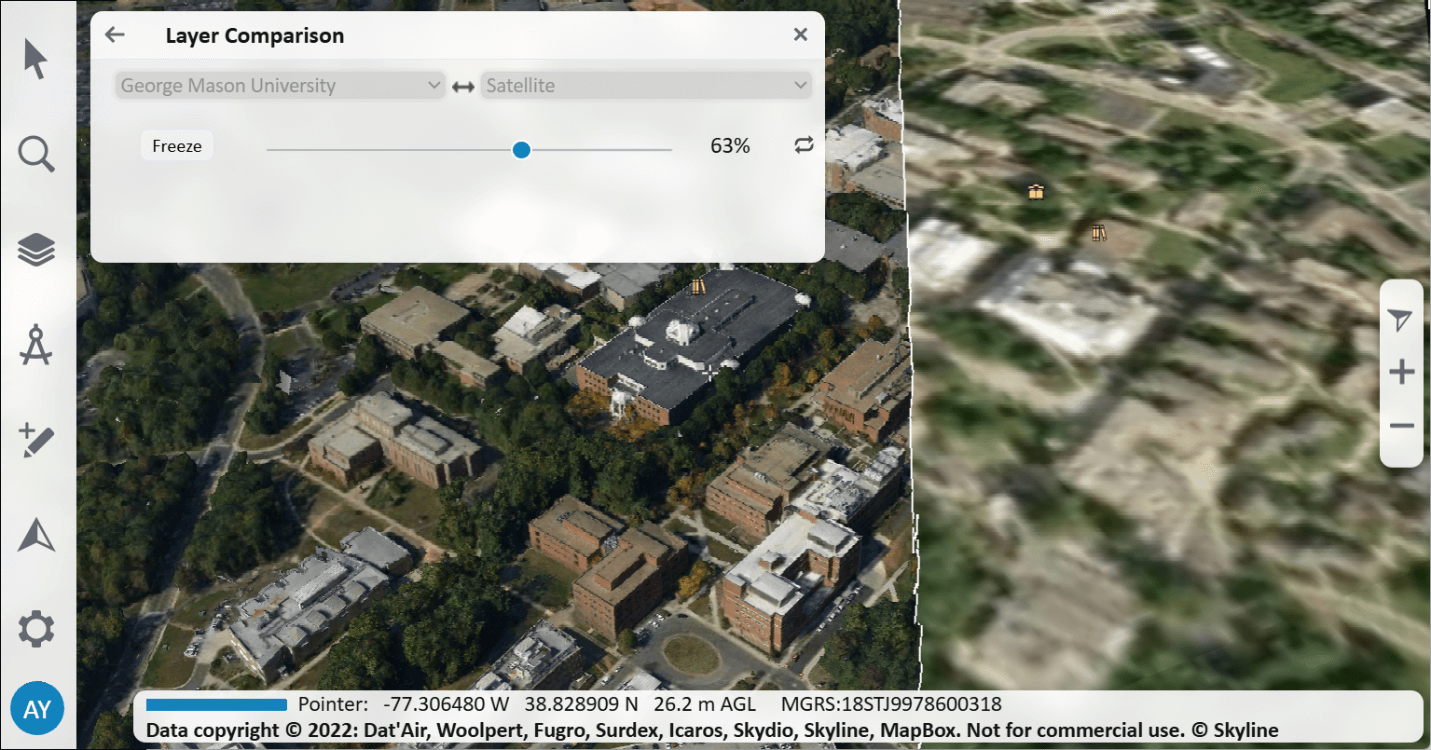
Swipe and Compare
The Swipe Layers tool helps you detect the changes between two layers in the same location of any of the following types: 3D, point cloud, or imagery, or between one of these layer types and the base terrain. Using the tool, you can horizontally swipe between them, dynamically revealing and hiding parts of each layer.
To swipe and compare two layers:
1. On the side toolbar > ![]() > Tools tab > Compare.
> Tools tab > Compare.
2. In the Layer Comparison panel, toggle on or off any of the following: 3D, Point Cloud, and Imagery to filter the selection to the layer type(s) you want.
3. Select the layers for comparison from the two dropdown lists, and click Start.
4. Slide the slider all the way to the right to completely show the first layer, and all the way to the left to completely show the second one. As the slider moves between these extremes, the first layer is gradually clipped to reveal the second one.
5. Click Auto-Repeat ![]() to automatically loop the slider value between 0-100% to dynamically change the top layer clipping. Click Freeze at any point to freeze the slider at a specific value.
to automatically loop the slider value between 0-100% to dynamically change the top layer clipping. Click Freeze at any point to freeze the slider at a specific value.
Inspector
The Inspector tool displays the photos used to generate a 3D PhotoMesh model so you can view and inspect any section of your model (tower, bridge, construction site, etc.) without distortions or filters. Photo Inspector makes it easy to navigate within the model and between the model and its associated photos, providing real world coordinates for each photo pixel, so you can find the best photos for each area of the model. This tool is only available in TerraExplorer Fusion Plus.
The Photo Inspector also provides a set of drawing and measurement tools to mark areas and locations on the model with inspection points, polylines, or polygons.
To perform photo inspections, the Photo Inspector tool requires access to the PhotoMesh 3D model output (3DML/o3DML) and the photos layer generated by PhotoMesh's aerotriangulation process. The tool also needs access to the folder or server containing the original photos (AT Calculated Photos) used by PhotoMesh.
Inspecting Your Model
To inspect your model:
1. On the side toolbar > ![]() > Tools tab > Inspector. The Inspector tool is displayed. If there is only one photo layer and one or no inspection layers in the project, these layers are automatically selected and the Photo Inspector Quick Guide directly opens. Skip to step 4.
> Tools tab > Inspector. The Inspector tool is displayed. If there is only one photo layer and one or no inspection layers in the project, these layers are automatically selected and the Photo Inspector Quick Guide directly opens. Skip to step 4.
2. The Photos Layer field is automatically populated with the AT Calculated Photos layer in the project. If there are multiple Calculated Photos layers, select the required layer from the dropdown list.
3. Click Start. The Photo Inspector Quick Guide is displayed.
4. To set an inspection point, click Zoom in ![]() to view the inspection area.
to view the inspection area.
5. Click Set inspection point ![]() (Shortcut key: "m") and then click on the model in the point of interest. The photos looking at the point are listed in the Photo Inspector lists under the main and secondary viewers. In the 3D Window, photo icons are displayed for each of the photos looking at the point.
(Shortcut key: "m") and then click on the model in the point of interest. The photos looking at the point are listed in the Photo Inspector lists under the main and secondary viewers. In the 3D Window, photo icons are displayed for each of the photos looking at the point.
6. If the photo viewers are displayed, you can select a new point of interest by clicking Set inspection point ![]() , and then clicking on one of the photos.
, and then clicking on one of the photos.
7. Use the Reset ![]() button on the toolbar to clear the inspection point, close the photo viewers and reset the visibility filter on the photo’s layer in the 3D Window to view all photo icons.
button on the toolbar to clear the inspection point, close the photo viewers and reset the visibility filter on the photo’s layer in the 3D Window to view all photo icons.
8. Click ![]()
![]() to toggle between a single viewer (main) and two viewers (main and secondary).
to toggle between a single viewer (main) and two viewers (main and secondary).
Using the photo viewers (main and secondary)
After selecting a point of interest, the Photo Inspector selects the most relevant photo and zooms in to the selected point on the photo in the photo viewer. The selected point is marked by a blue crosshairs ![]() on the photo and on the 3D model. All the photos looking at the point that meet the following criteria, are listed in the Photo Inspector under the main and secondary viewers:
on the photo and on the 3D model. All the photos looking at the point that meet the following criteria, are listed in the Photo Inspector under the main and secondary viewers:
§ Its location is within the Settings-Search distance value of the point of interest.
§ It was calculated by PhotoMesh's aerotriangulation process.
§ The point of interest was projected within the photo frame but not too close (> 50 pixels) to the edge of the photo.
The number of photos listed in the viewers is determined by the Max Results per Viewer setting. The photos are listed in order from most relevant to the point of interest to least relevant according to the following criteria:
§ Distance between the photo and the selected point
§ Angle of the camera to the selected point in comparison to the viewer angle
If the selected point is on a horizontal surface (road, roof), more weight is given to the distance factor. If the selected point is on a vertical surface, more weight is given to the angle.
Selecting the viewers for display
The Photo Inspector includes two viewers as described below. In Settings, you can choose to display either a single viewer (main) or both a main and a secondary viewer, and specify the photos to be shown in the secondary viewer:
§ Main photo viewer – If only one viewer is set, then the main viewer shows all photos. In dual viewer mode, it can be set to show either only RGB photos or only photos looking at the point of interest from the front and above (depends on the secondary photo viewer settings).
§ Secondary photo viewer – The secondary photo viewer is used to display alternative photos to the main viewer. There are two options for the secondary viewer:
§ From Alternative Direction: Photos looking at the point of interest from the left, right, and behind.
§ Non-RGB Photos: If the project contains RGB and non-RGB collections, the secondary viewer can be used to view the non-RGB photos (e.g., NIR, thermal). In this case, the main viewer displays RGB photos from all angles and the secondary viewer displays non-RGB photos from all directions.
Attaching the secondary viewer to the main viewer
Attaching the secondary viewer to the main one links the two viewers so that the secondary viewer moves to focus on the same center point as in the main viewer, whenever you drag or zoom in the main viewer. If the center point doesn't exist in the photo shown in the secondary viewer, a black photo is displayed.
To attach the secondary photo viewer to the main viewer:
§ In Settings, toggle on the Attached to Main option.
Viewing an inspection point in photos
After selecting a point of interest, the Photo Viewer’s Photo Inspector lists show the most relevant photos according to the Max Results per Viewer setting.
To view the inspection point in the photos, do any of the following:
§ Select a photo in the viewers' dropdown photo lists.
§ Use the Next/Previous buttons ![]() or the keyboard shortcuts "<", ">" to browse through the photos.
or the keyboard shortcuts "<", ">" to browse through the photos.
§ In the 3D Window, click any camera icon to display the photo associated with it in the relevant viewer (main or secondary).
Marking Up Your Model
To mark and measure areas in your 3D model or on photos in the Photo Inspector:
1. On the side toolbar > ![]() > Tools tab > Inspector.
> Tools tab > Inspector.
2. The Inspection Layer field is automatically populated with all polyline or polygon feature layers in the project in the project. Select the required layer from the dropdown list. Only choose a layer for which you have Edit access. You can first load an inspection feature layer from SkylineGlobe Server into the project, if required.
3. Click Start. The Photo Inspector Quick Guide is displayed. Do any of the following on the Photo Inspector toolbar:
§ To add an inspection line or polygon, click Draw inspection line on model or photo ![]() . The inspection line is drawn according to the Draw Mode style selected in the Photo Inspector settings. In all modes you can draw the lines on the 3D model or on the photos:
. The inspection line is drawn according to the Draw Mode style selected in the Photo Inspector settings. In all modes you can draw the lines on the 3D model or on the photos:
· Polyline - Place the polyline points by clicking in the desired locations. Finish the polyline creation by right-clicking.
· Freehand Line – Click and hold the left mouse button and draw the freehand line on the 3D model or on a Photo. Release the left mouse button to complete the drawing.
· Polygon - Place the polygon points by clicking in the desired locations. Finish the polygon creation by right-clicking.
§ To add an inspection point, click Draw inspection point on model or photo ![]() . Then click anywhere on the model or on a photo.
. Then click anywhere on the model or on a photo.
§ To measure distance, click Start distance measurement ![]() . Click any point on the model or on a photo to define the start point of the measurement. A yellow line extends from the start point. Click again to add additional measurement points. Right-click to finish the measurement.
. Click any point on the model or on a photo to define the start point of the measurement. A yellow line extends from the start point. Click again to add additional measurement points. Right-click to finish the measurement.
4. To view a list of markings and measurements to an inspection layer, on the Photo Inspector toolbar, click Show list of inspection drawings ![]() . The Inspections List is displayed, showing a table of all the inspections markings and measurements in the layer.
. The Inspections List is displayed, showing a table of all the inspections markings and measurements in the layer.
5. Do any of the following:
§ Click View ![]() to zoom in the model in the 3D Window to the selected inspection marking or measurement.
to zoom in the model in the 3D Window to the selected inspection marking or measurement.
§ Click Show Photos ![]() to open the Photo Viewer and show photos looking at the area marked by your inspection feature.
to open the Photo Viewer and show photos looking at the area marked by your inspection feature.
§ Click Edit ![]() to open the Inspection Properties dialog for the selected inspection marking or measurement. Then enter the inspection attributes: title, severity level, and author. Perform any of the following operations in the Inspection Properties dialog:
to open the Inspection Properties dialog for the selected inspection marking or measurement. Then enter the inspection attributes: title, severity level, and author. Perform any of the following operations in the Inspection Properties dialog:
· Click Delete ![]() to delete the inspection drawing.
to delete the inspection drawing.
· Click Redraw ![]() to redraw the inspection drawing.
to redraw the inspection drawing.
· Click Zoom in ![]() to zoom in to the inspection drawing.
to zoom in to the inspection drawing.
· Click Show Photos ![]() to open the Photo Viewer and show photos looking at the area marked by your inspection feature.
to open the Photo Viewer and show photos looking at the area marked by your inspection feature.
Settings
Settings for your current inspection project can be viewed and edited from the Photo Inspector Settings dialog. These settings include general project information, viewer properties, photo filter settings, and inspection layer properties. The settings are saved separately for each photo layer and applied when closing the Settings dialog (either by clicking X or Close).
To view and modify photo inspector settings:
§ On the Photo Inspector toolbar, click Settings ![]() , and view/modify the settings as required:
, and view/modify the settings as required:
|
Parameter |
Description |
|
Settings |
|
|
Camera Symbol Size |
Enter the size of the camera symbols that should display for each photo. |
|
Search distance, in meters, for photos looking at the selected point. Enter a value that is suitable for the effective range of photos in your project. |
|
|
Number of photos that will be listed in the photo viewer photos list (for both the main viewer and secondary viewer). |
|
|
Secondary Viewer |
|
|
Show Secondary Viewer |
In a single viewer mode, the main viewer shows photos from all directions. When a secondary viewer is shown, it displays alternative photos to the main viewer: either from alternative directions or non-RGB photos (depends on the Secondary viewer settings). |
|
Attaching the secondary viewer to the main one links the two viewers so that the secondary viewer moves to focus on the same center point as in the main viewer, whenever you drag or zoom in the main viewer. |
|
|
Select what to display in the secondary viewer: § From alternative direction - Photos looking at the point of interest from the left, right, and behind § Non-RGB photos - e.g., NIR, thermal |
|
|
Inspection Layer |
|
|
Inspection Layer |
Select the required inspection layer. |
|
Select the drawing mode for the inspection markings: § Polyline § Freehand line § Polygon |
|
|
Line Width |
Line width of the inspection markings. |
|
Max Symbols per Photo |
Maximum number of inspection markers and measurements to display on each photo viewer. A large number of drawings may affect the tool's speed. |
|
Measurement Units |
Select Metric or U.S. Imperial. |
|
Project Information |
|
|
Project Name |
Name of project. |
|
Project Description |
Free text describing the project. |
|
Created for |
Free text identifying the company commissioning the project. |
|
Author |
Name of inspector. |
Clear Path
The Clear Path tool helps users identify suitable locations for specific purposes, such as helicopter landing zones or vehicle pathways. It offers preliminary indications based on user-defined criteria within a specified search radius. This tool is only available in TerraExplorer Fusion Plus.
To clear a path:
1. On the side toolbar > ![]() > Tools tab > Clear Path.
> Tools tab > Clear Path.
2. In the Clear Path panel, in the Search For field, select a predefined location (e.g., helicopter landing zone). The minimum width and maximum slope are automatically set to those suitable for your selected location type. If you want to set your own minimum width and maximum slope parameters, select Custom.
3. In the Search Radius, set the radius within which you want the tool to search for appropriate locations .
4. Click Set Location, and then click in the 3D Window to define the center of your search area. When the surface analysis is complete, the dialog displays the analysis results and a feature layer is created in the 3D Window showing in green all points that match the search criteria.
High and Low
The High and Low tool identifies elevation differences in a selected area of interest. It colorizes the highest and lowest regions based on the percentage values set. For example, if you set a top percentage of 15% and a bottom percentage of 10%, the tool will colorize the highest 15% and the lowest 10% of the area. This tool is only available in TerraExplorer Fusion Plus.
To highlight high and low areas:
1. On the side toolbar > ![]() > Tools tab > High and Low.
> Tools tab > High and Low.
2. In the High and Low panel, in the Highlight Mode field, select High and Low Areas to highlight both, or select only High/Low areas.
3. Set the Top and Bottom Percentage.
4. In the Search Radius, set the radius within which you want the tool to analyze .
5. Click Set Location, and then click in the 3D Window to define the center of your search area. When the surface analysis is complete, the dialog displays the analysis results and a feature layer is created in the 3D Window showing the highest and lowest areas.
Cross Section
The Cross Section tool makes a horizontal or vertical straight cut to expose obscured sections of the 3D View. The cross section slider increments are based on the Plane Size set and the distance between the camera and the plane when creating the cross section box, i.e., the narrower the plane and the closer the camera, the smaller the increments. This tool is only available in TerraExplorer Fusion Plus.
To use the Cross Section tool:
1. On the side toolbar > ![]() > Tools tab > Cross Section.
> Tools tab > Cross Section.
2. Select the mode.
§ Auto – The direction of the cross section automatically adjusts based on the surface under the cursor. If the cursor points at a vertical surface, such as the side of a building, a vertical cross section is created. Conversely, when the cursor is over the terrain or any horizontal flat surface, like rooftops, a horizontal cross section is generated.
§ Horizontal – Create horizontal cross sections.
§ Vertical – Create vertical cross sections.
3. Click Start.
4. In the 3D Window, click where you want to create a cross section.
5. Adjust the cross-section plane using the sliders:
§ Move ![]() – Repositions the cross-section plane. When cutting a horizontal cross section, slide the slider to the right to lower the plane (increasing the section being clipped), and left to raise it. When cutting a vertical cross section, slide the slider to the left to move the cross-section plane forward, and right to move it backward.
– Repositions the cross-section plane. When cutting a horizontal cross section, slide the slider to the right to lower the plane (increasing the section being clipped), and left to raise it. When cutting a vertical cross section, slide the slider to the left to move the cross-section plane forward, and right to move it backward.
§ Size ![]() – Changes the size of the plane. Slide right to increase size, left to decrease.
– Changes the size of the plane. Slide right to increase size, left to decrease.
§ Rotate ![]() – Rotates the plane (0–360°).
– Rotates the plane (0–360°).
Visibility Dome
The Visibility Dome tool analyzes and displays the area that is visible from a given point on the terrain within a 360° horizontal field of view. Several display options for the Visibility Dome are available so that the particular information required can be easily visualized. The Visibility Dome can be generated as a dome that defines the outer boundaries of the volume that is visible from the viewpoint, as a dome base that divides between visible and non-visible areas, or alternatively as a skyline that highlights obstructions to the field of view. After generating the visibility dome, results can be further analyzed by creating a profile graph.
To use the Visibility Dome tool:
1. On the side toolbar > ![]() > Tools tab > Visibility Dome.
> Tools tab > Visibility Dome.
2. Select the mode.
§ Dome ![]() –Generates a full 3D dome-shaped volume that represents the areas of the 3D model and surrounding airspace visible from the selected viewpoint, within the specified radius and elevation angle. The dome is bounded by terrain, 3D models, and other obstructions that limit line of sight. Ideal for analyzing visibility coverage, threat envelopes, and sensor line-of-sight in complex environments.
–Generates a full 3D dome-shaped volume that represents the areas of the 3D model and surrounding airspace visible from the selected viewpoint, within the specified radius and elevation angle. The dome is bounded by terrain, 3D models, and other obstructions that limit line of sight. Ideal for analyzing visibility coverage, threat envelopes, and sensor line-of-sight in complex environments.
§ Dome Base ![]() – Displays a circular surface on the ground that delineates the boundary between visible and non-visible areas from the viewpoint, based on the specified elevation angle. Useful for assessing ground-level visibility within a constrained vertical field of view.
– Displays a circular surface on the ground that delineates the boundary between visible and non-visible areas from the viewpoint, based on the specified elevation angle. Useful for assessing ground-level visibility within a constrained vertical field of view.
§ Skyline ![]() – Highlights the silhouette of terrain and 3D objects that obstruct the view from the selected location, forming a visible horizon line. This mode is ideal for quickly identifying key obstructions in all directions.
– Highlights the silhouette of terrain and 3D objects that obstruct the view from the selected location, forming a visible horizon line. This mode is ideal for quickly identifying key obstructions in all directions.
§ Skyline Base ![]() – Draws radial lines from the viewpoint outward to the skyline, helping visualize the connection between the observer and the skyline edge. Useful for understanding the spatial relationship between the viewpoint and visibility limits.
– Draws radial lines from the viewpoint outward to the skyline, helping visualize the connection between the observer and the skyline edge. Useful for understanding the spatial relationship between the viewpoint and visibility limits.
3. Set the following properties:
§ Radius – Sets the distance from the viewpoint within which visibility is analyzed.
§ Viewer Altitude – Defines the height of the observer above the ground or object surface at the viewpoint.
§ Elevation Angle – Specifies the vertical viewing angle from the viewpoint. A value of 0° produces a hemispherical view (or its base, if using Dome Base), while a higher angle narrows the vertical visibility cone.
4. Click Set Position to manually place a viewpoint on the 3D model by clicking in the scene.
5. In the 3D Window, click where you want to place a viewpoint. The visibility dome is generated. After the visibility dome is created, a profile graph can be displayed to show the height of the dome or the Skyline ring. It includes tools for identifying waypoints, elevation extremes, and slope changes.
6. If you want to view a profile analysis for the visibility dome, in the Visibility Dome panel, click Profile Analysis ![]() . A terrain profile graph is displayed, showing the terrain elevation profile. Turn on the information you want indicated on the graph: polyline waypoints, min/max altitude and max slope.
. A terrain profile graph is displayed, showing the terrain elevation profile. Turn on the information you want indicated on the graph: polyline waypoints, min/max altitude and max slope.
Display Measurement and Volume Objects
To display a measurement or analysis object:
§ On the side toolbar > ![]() > in My Data section, select the required object. Right-click to fly or jump to the object or to delete it.
> in My Data section, select the required object. Right-click to fly or jump to the object or to delete it.