Distance Tool
The Distance tool measures aerial, horizontal and vertical distance and slope between two or more points. You can also calculate and display the terrain elevation profile for the aerial measurement line.
To use the distance tool:
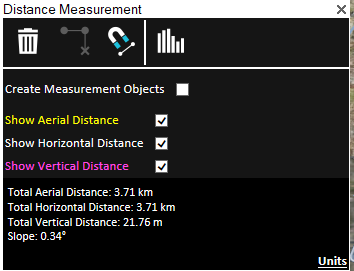
1. On the Analysis tab, in the Measurement group, click Distance. The Distance Measurement dialog is displayed with the following distance options:
§ Create Measurement Objects – Select the check box if you want to create measurement objects that will be accessible from the Measurement Objects folder in the Project Tree.
§ Show Aerial Distance – Show a yellow line marking the aerial distance, i.e., the actual distance between points, in the 3D Window. The aerial distance is calculated and displayed in the Distance Measurement dialog even if this option is not selected.
§ Show Horizontal Distance – Show a white line marking the horizontal distance between points in the 3D Window. The horizontal distance is calculated and displayed in the Distance Measurement dialog even if this option is not selected.
§ Show Vertical Distance – Show a purple line marking the vertical distance between points in the 3D Window. The vertical distance is calculated and displayed in the Distance Measurement dialog even if this option is not selected.

Distance Measurement
2. If you want to change measurement units, click the Units link. The Options dialog is displayed, showing the View tab. Modify the display options for Altitude and Distance and Measurement, and then click OK. See “View” in the “Using TerraExplorer Options” chapter for more information.
3. If you want to snap the measurement points to an object’s edge or vertex, click Snap Based on Snapping Options ![]() . TerraExplorer automatically detects all edges, i.e., intersections of two plane faces, and vertices, i.e., intersections of two polylines.
. TerraExplorer automatically detects all edges, i.e., intersections of two plane faces, and vertices, i.e., intersections of two polylines.
4. In the 3D Window, click any point on the terrain or on an object to define the start point of the measurement. A yellow line extends from the start point. Drag the cursor to the next point and click again. Repeat to add as many segments as required. If you want to delete the last point added, click Delete Point ![]() .
.
5. Right-click to finish the measurement.
6. If you want to obtain the same measurement type between any two or more points in the terrain, with the Distance command selected, repeat steps 2-5 above.
The Distance dialog displays the following measurements:
|
Measurement |
Description |
|
Total Aerial Distance |
The aerial distance, i.e., the actual distance between the points. This measurement is the sum of the aerial distances between the points as you progress from the start point to the endpoint. |
|
Total Horizontal Distance |
The horizontal distance between the points. This measurement is the sum of the horizontal distances between the points as you progress from the start point to the endpoint. |
|
Total Vertical Distance |
The difference in elevation between the points. If you have marked more than two points, this measurement does not take into account the elevation values of the middle points. |
|
Slope |
The slope of the line between the first and last points. If you have marked more than two points, this measurement does not take into account anything other than the elevation at the start point and the elevation at the endpoint. |
7. If you want to delete the measurement polyline in the 3D Window, click Delete ![]() .
.
8. If you want to display the terrain elevation profile along the drawn line, and related information such as maximum and minimum elevation values and slope, do the following:
a. Click Terrain Profile ![]() . A terrain profile graph opens, displaying the terrain elevation profile.
. A terrain profile graph opens, displaying the terrain elevation profile.

Terrain Profile Graph
b. Use the Zoom in ![]() , Zoom out
, Zoom out ![]() , and Zoom to full extent of data
, and Zoom to full extent of data ![]() buttons to adjust the zoom as required.
buttons to adjust the zoom as required.
c. Determine what information is indicated on the graph by selecting any of the following display options:
|
Waypoint |
Select the check box to mark each of the polylines' waypoints on the graph with a |
|
Min/Max Elevation |
Select the check box to mark each of the polylines' maximum and minimum points with a |
|
Min/Max Slope |
Select the check box to mark each of the polylines' maximum and minimum slope with a |
d. If you want to export the terrain profile to a shapefile layer, click Export to Layer.
e. Point to any point on the graph to display the following values. If you want to display the values and jump to the point on the terrain, then click instead of pointing.
|
Value |
Description |
|
X |
X-coordinate of the selected point. |
|
Y |
Y-coordinate of the selected point. |
|
MGRS |
The coordinates of the selected point converted to Military Grid Reference System (MGRS) coordinates. This field is only available if Show MGRS Coordinates was selected in the Options dialog. See “View” in the “Using TerraExplorer Options” chapter for more information. |
|
Elevation |
Elevation value of the point above the terrain database vertical datum base ellipsoid. |
|
Slope |
Slope of the curve at the selected point |